12.7
Bohr’s Theory of the Hydrogen Atom
Chapter contents: Chapter 12: Quantum Mechanics
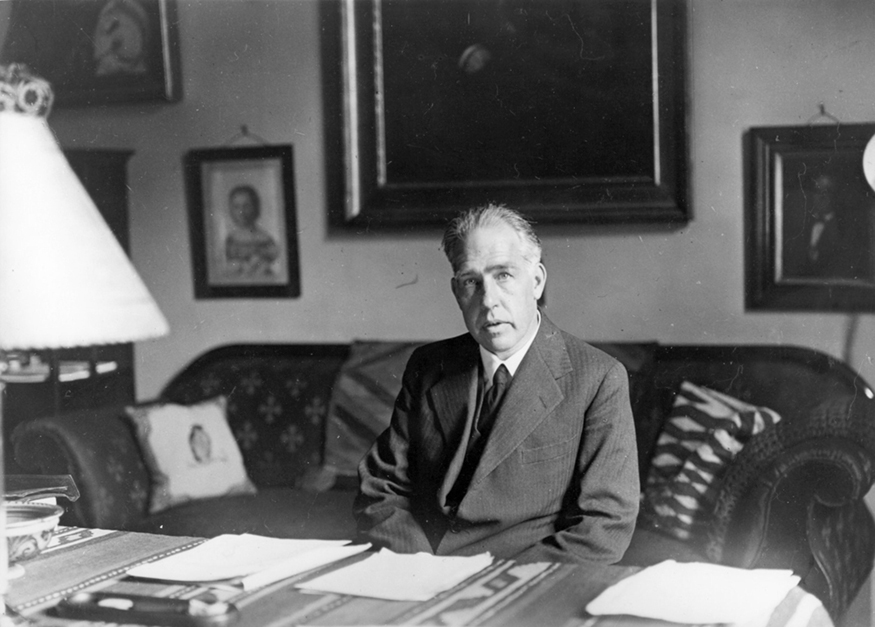
The great Danish physicist Niels Bohr (1885–1962) made immediate use of Rutherford’s planetary model of the atom. (Figure 12.7.1). Bohr became convinced of its validity and spent part of 1912 at Rutherford’s laboratory. In 1913, after returning to Copenhagen, he began publishing his theory of the simplest atom, hydrogen, based on the planetary model of the atom. For decades, many questions had been asked about atomic characteristics. From their sizes to their spectra, much was known about atoms, but little had been explained in terms of the laws of physics. Bohr’s theory explained the atomic spectrum of hydrogen and established new and broadly applicable principles in quantum mechanics.
Atomic Spectra
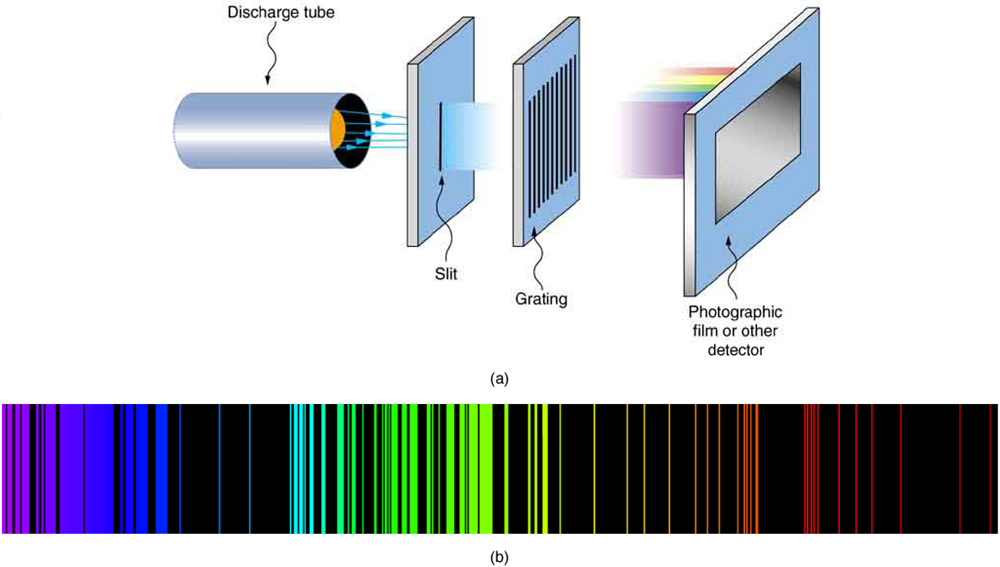
Atomic and molecular emission and absorption spectra have been known for over a century to be discrete (or quantized). Well before they were understood from first principles, chemists have been using the emission and absorption spectra for identification of elements. Figure 12.7.2 shows iron emission spectrum, for example. No other elements emit the exactly the same set of frequencies of light. With the discovery of substructure of the atom and the discovery of photon (or more precisely, refined understanding of the particle nature of electromagnetic waves where the particle energy is proportional to the frequency of electromagnetic waves), these resonant frequencies of light emitted by atoms could be used to infer an atomic model.
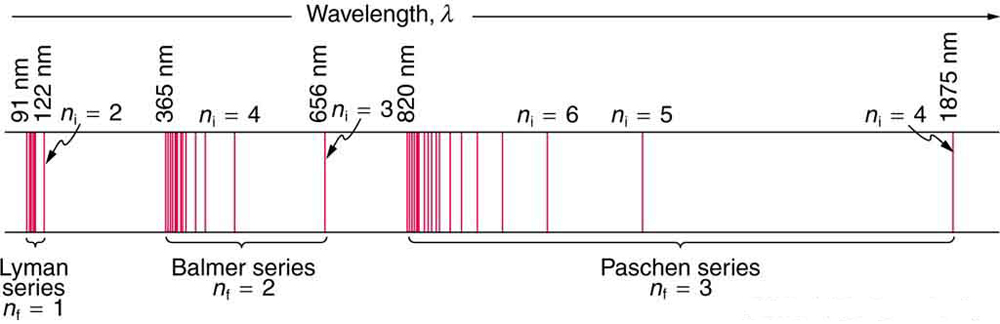
For the hydrogen atom, the lightest element with the simplest atom, a pattern for its line spectrum was noticed by experimentalists (see Figure 12.7.3). All wavelengths of the line spectrum could be described by a following formula, for the suitable choice of two integers and :
(12.7.1)
where is the wavelength of the emitted EM radiation and is the Rydberg constant, determined by the experiment to be
The is a positive integer associated with a specific series, which are named after their discoverers. For the Lyman series, ; for the Balmer series, ; for the Paschen series, ; and so on. The Lyman series is entirely in the UV, while part of the Balmer series is visible with the remainder UV. The Paschen series and all the rest are entirely IR. There are apparently an unlimited number of series, although they lie progressively farther into the infrared and become difficult to observe as increases. The is a positive integer greater than . So for example, for the Balmer series, and
.
So, before Bohr's model of the hydrogen atom, such was the picture of atomic theory—full of suggestive (and even well-organized) data and no unifying explanation. Ernest Rutherford is quoted as saying, "All science is either physics or stamp-collecting." What he meant is, there are branches of science whose practitioners would be satisfied with a collection of interesting facts (i.e. "stamp-collecting"). But what makes physics physics is the search for the theoretical framework providing explanations based on fundamental principles, not idiosyncratic descriptions. Bohr's model brought the science of spectroscopy into physics.
Bohr's Model for Hydrogen
The planetary model of the atom suggested by Rutherford was in trouble. While the model provided a possible picture of how the very small atomic nucleus might be arranged with the electrons in a stable arrangement, it did not provide for the size of electron orbits (which would be related to the size of the atom), and the arrangement was not actually stable—an orbiting electron is an oscillating charge; an oscillating charge emits electromagnetic waves; electromagnetic waves carry away energy; so as the electron loses energy, it would fall into the proton. By some estimates, this would occur in as short a time as !
Bohr's starting point for his successful model was this: he proposed that the orbits of electrons in atoms are quantized. To fully understand this statement, we can compare the orbits of electrons in atoms to the orbits of planets in the solar system. The orbits of planets are not quantized. While laws of physics govern how planets move in the solar system (see for example, Kepler's laws, or their derivation by Newton starting with the inverse-square law of gravitation), there is no law of physics dictating how far each body in the solar system must be from the Sun. So the orbits of planets are not quantized.
So what Bohr was proposing was an entirely new law of physics no one had known before. In one sense, it was not completely new (Planck and Einstein already enjoyed some successes from suggesting quantization of energy in thermal oscillators and EM radiation); in another sense, it was a big break from centuries of classical mechanics. This was Bohr's quantization rule: angular momentum of an electron in its orbit is quantized. In mathematical form,
(12.7.3)
where could take on any positive integer value (), and is known as the reduced Planck constant (). And angular momentum, , as you might remember from earlier chapter, is given by the following for a particle in a uniform circular orbit: , where is the mass of the particle, is the speed of the particle in orbit, and is the radius of circular orbit. Using this as the starting point, semiclassical analysis of orbital motion yields a whole array of quantized (i.e. allowed) values of orbital distance (), orbital speed (), and orbital energy (), among others (see: Table 12.7.1 for a summary).
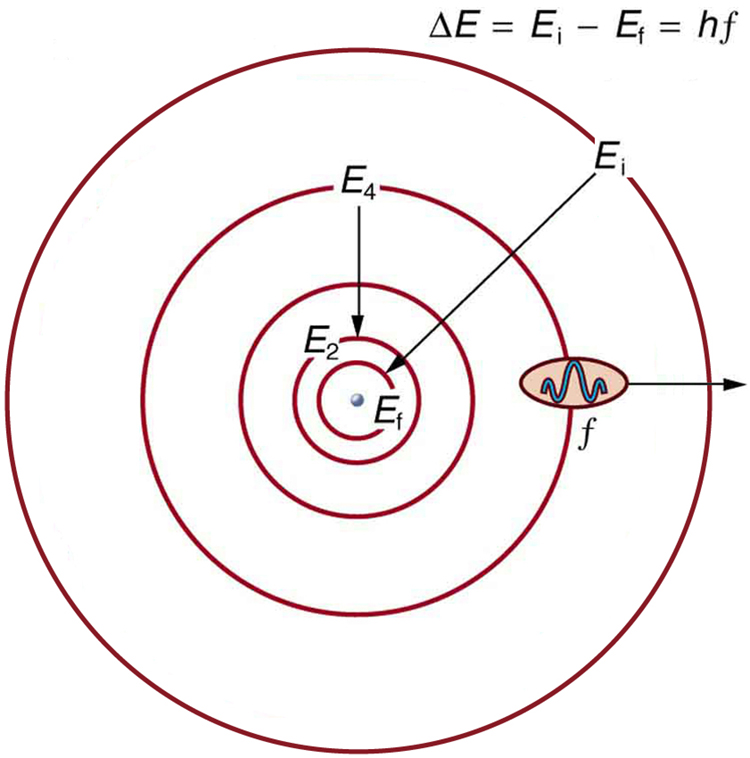
With the quantized orbital energies for the electron, we have a ready explanation for the features of atomic spectra. EM radiation is emitted when an electron transitions from a higher energy level () to a lower energy level (), with the photon carrying away the energy difference,
(12.7.4)
where is the frequency of the photon. Figure 12.7.4 shows a schematic representation of this relationship. With only discrete values of energy allowed, there are only discrete values of frequency () and wavelength () allowed also, as shown in the line spectra.
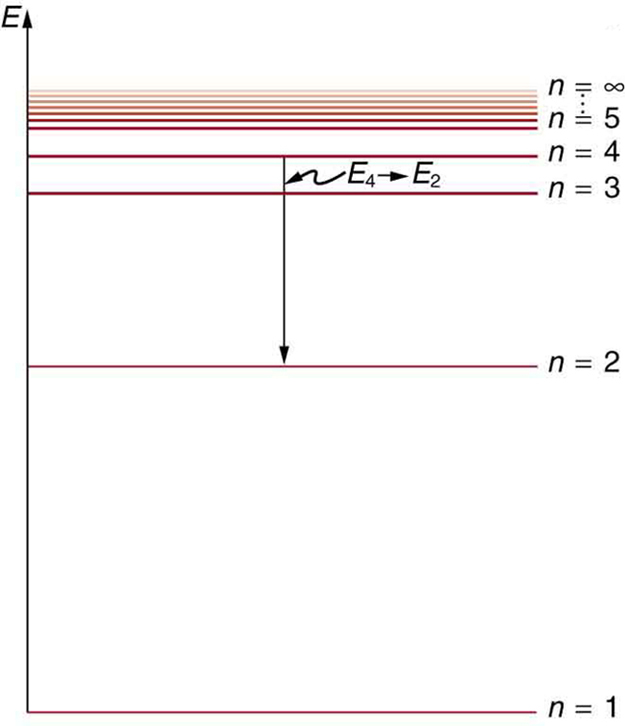
Energy-level diagram, shown in Figure 12.7.5, is another convenient way to illustrate these relationships. Allowed energy levels for the atom are plotted vertically with the lowest state (or ground state) at the bottom and with excited states above that. The energies of the lines in an atomic spectrum correspond to the differences in energy levels in the level diagram (figure illustrates a transition from to , which would show up in the atomic spectrum as one line).
| Quantized quantity | Dependence on quantum number | Full expression |
| angular momentum: | proportional to | |
| orbital radius: | proportional to | |
| orbital speed: | proportional to | |
| orbital energy: | proportional to |
Two key results are worth highlighting. The first is the Bohr radius, or the smallest orbital radius , given for ,
(12.7.5)
This is the Bohr model's prediction for the size of the atom, made with nothing more than electric constants, mass of the electron, and the Planck's constant, and this theoretical prediction matches experimentally measured sizes of atoms fairly well.
The second is the derivation of the Rydberg formula, first given in Equation 12.7.1. To derive this, we start out with Equation 12.7.4 and substitute in expressions for hydrogen energies from Table 12.7.1:
(12.7.6)
Frequency is equal to . Plugging this in and solving for while also replacing all instances of with , we get,
(12.7.7)
which yields an analytical expression for the Rydberg constant,
(12.7.8)
Figure 12.7.6 shows an energy-level diagram for hydrogen that also illustrates how the various spectral series for hydrogen are related to transitions between energy levels.
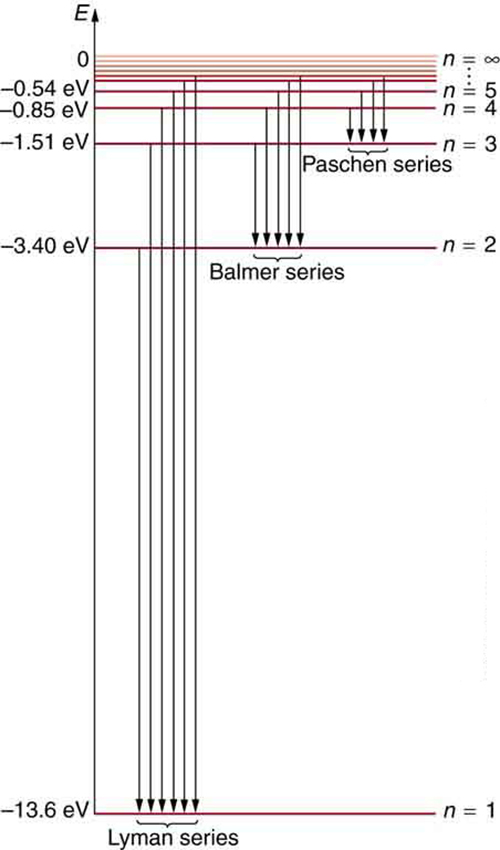
We see that Bohr’s theory of the hydrogen atom answers the question as to why this previously known formula describes the hydrogen spectrum. It is because the energy levels are proportional to , where is a non-negative integer. A downward transition releases energy, and so must be greater than . The various series are those where the transitions end on a certain level. For the Lyman series, — that is, all the transitions end in the ground state (see also Figure 12.7.6). For the Balmer series, , or all the transitions end in the first excited state; and so on. What was once a recipe is now based in physics, and something new is emerging—angular momentum is quantized.
Triumphs and Limits of the Bohr Theory
Bohr did what no one had been able to do before. Not only did he explain the spectrum of hydrogen, he correctly calculated the size of the atom from basic physics. Some of his ideas are broadly applicable. Electron orbital energies are quantized in all atoms and molecules. Angular momentum is quantized. The electrons do not spiral into the nucleus, as expected classically. These are major triumphs.
But there are limits to Bohr’s theory. It cannot be applied to multielectron atoms, even one as simple as a two-electron helium atom. Bohr’s model is a semiclassical model. The orbits are quantized (quantum mechanical) but are assumed to be simple circular paths (classical). As quantum mechanics was developed, it became clear that there are no well-defined orbits; rather, there are "clouds" of probability. Bohr’s theory also did not explain that some spectral lines are doublets (split into two) when examined closely. These deficiencies are addressed in later, fully-quantum-mechanical atomic models, but it should be kept in mind that Bohr did not fail. Rather, he made very important steps along the path to greater knowledge and laid the foundation.
Section Summary
- The planetary model of the atom pictures electrons orbiting the nucleus in the way that planets orbit the sun. Bohr used the planetary model to develop the first reasonable theory of hydrogen, the simplest atom. Atomic and molecular spectra are quantized, with hydrogen spectrum wavelengths given by the formula
where is the wavelength of the emitted EM radiation and is the Rydberg constant, which has the value(12.7.9)(12.7.10)
- The constants and are positive integers, and must be greater than .
- Bohr correctly proposed that the energy and radii of the orbits of electrons in atoms are quantized, with energy for transitions between orbits given by
where is the change in energy between the initial and final orbits and is the energy of an absorbed or emitted photon. It is useful to plot orbital energies on a vertical graph called an energy-level diagram.(12.7.11)
- Bohr proposed that the allowed orbits are circular and must have quantized orbital angular momentum given by where is the angular momentum, is the radius of the orbit, and is Planck’s constant.(12.7.12)
- Additional quantized orbital quantities—orbital radius, orbital speed, and orbital energy—can be derived starting from Bohr's assumption, and they yield predictions consistent with the experimental Rydberg formula.
- While Bohr's semiclassical model of the atom does not account for all experimental facts about the atom, it is an important stepping stone to fully-quantum-mechanical models of the atom.
Conceptual Questions
Exercise 16
How do the allowed orbits for electrons in atoms differ from the allowed orbits for planets around the sun? Explain how the correspondence principle applies here.
Exercise 17
Explain how Bohr’s rule for the quantization of electron orbital angular momentum differs from the actual rule.
Exercise 18
What is a hydrogen-like atom, and how are the energies and radii of its electron orbits related to those in hydrogen?
Problems & Exercises
Exercise 63
By calculating its wavelength, show that the first line in the Lyman series is UV radiation.
Solution
so that
, which is UV radiation.
Exercise 64
Find the wavelength of the third line in the Lyman series, and identify the type of EM radiation.
Exercise 65
Look up the values of the quantities in , and verify that the Bohr radius is .
Solution
Exercise 66
Verify that the ground state energy is 13.6 eV by using
Exercise 67
If a hydrogen atom has its electron in the state, how much energy in eV is needed to ionize it?
Solution
0.850 eV
Exercise 68
A hydrogen atom in an excited state can be ionized with less energy than when it is in its ground state. What is for a hydrogen atom if 0.850 eV of energy can ionize it?
Exercise 69
Find the radius of a hydrogen atom in the state according to Bohr’s theory.
Solution
Exercise 70
Show that (Rydberg’s constant), as discussed in the text.
Exercise 71
What is the smallest-wavelength line in the Balmer series? Is it in the visible part of the spectrum?
Solution
365 nm
It is in the ultraviolet.
Exercise 72
Show that the entire Paschen series is in the infrared part of the spectrum. To do this, you only need to calculate the shortest wavelength in the series.
Exercise 73
Do the Balmer and Lyman series overlap? To answer this, calculate the shortest-wavelength Balmer line and the longest-wavelength Lyman line.
Solution
No overlap
365 nm
122 nm
Exercise 74
(a) Which line in the Balmer series is the first one in the UV part of the spectrum?
(b) How many Balmer series lines are in the visible part of the spectrum?
(c) How many are in the UV?
Exercise 75
A wavelength of is observed in a hydrogen spectrum for a transition that ends in the level. What was for the initial level of the electron?
Solution
7
Exercise 76
A singly ionized helium ion has only one electron and is denoted . What is the ion’s radius in the ground state compared to the Bohr radius of hydrogen atom?
Exercise 77
A beryllium ion with a single electron (denoted ) is in an excited state with radius the same as that of the ground state of hydrogen.
(a) What is for the ion?
(b) How much energy in eV is needed to ionize the ion from this excited state?
Solution
(a) 2
(b) 54.4 eV
Exercise 78
Atoms can be ionized by thermal collisions, such as at the high temperatures found in the solar corona. One such ion is , a carbon atom with only a single electron.
(a) By what factor are the energies of its hydrogen-like levels greater than those of hydrogen?
(b) What is the wavelength of the first line in this ion’s Paschen series?
(c) What type of EM radiation is this?
Exercise 79
Verify Equations and
using the approach stated in the text. That is, equate the Coulomb and centripetal forces and then insert an expression for velocity from the condition for angular momentum quantization.
Solution
so that From the equation we can substitute for the velocity, giving:
so that
where
.
Exercise 80
The wavelength of the four Balmer series lines for hydrogen are found to be 410.3, 434.2, 486.3, and 656.5 nm. What average percentage difference is found between these wavelength numbers and those predicted by ? It is amazing how well a simple formula (disconnected originally from theory) could duplicate this phenomenon.
hydrogen spectrum wavelengths
the wavelengths of visible light from hydrogen; can be calculated by
Rydberg constant
a physical constant related to the atomic spectra with an established value of
double-slit interference
an experiment in which waves or particles from a single source impinge upon two slits so that the resulting interference pattern may be observed
energy-level diagram
a diagram used to analyze the energy level of electrons in the orbits of an atom
Bohr radius
the mean radius of the orbit of an electron around the nucleus of a hydrogen atom in its ground state
hydrogen-like atom
any atom with only a single electron
energies of hydrogen-like atoms
Bohr formula for energies of electron states in hydrogen-like atoms: