8.14
Statistical Interpretation of Entropy and the Second Law of Thermodynamics: The Underlying Explanation
Chapter contents: Chapter 8: Thermal Physics
A macroscopic state can correspond to many microscopic arrangements. Entropy increases with the number of microscopic arrangements compatible with that state. Spontaneous changes overwhelmingly favor macroscopic states compatible with more microscopic arrangements. Counting those arrangements provides a statistical explanation of the second law of thermodynamics.
When you watch an emerging rain storm begin to wet the ground, you will notice that the drops fall in a disorganized manner both in time and in space. Some fall close together, some far apart, but you might never see them fall in straight, orderly rows. It is not impossible for rain to fall in an orderly pattern, just highly unlikely, because there are many more disorderly ways than orderly ones. To illustrate this fact, we will examine some random processes, starting with coin tosses.
Coin Tosses
What are the possible outcomes of tossing 5 coins? Each coin can land either heads or tails. On the large scale, we are concerned only with the total heads and tails and not with the order in which heads and tails appear. The following possibilities exist:
These are what we call macrostates. A macrostate is a description of a system in terms of its macroscopic properties. It does not specify the details of the system, such as the order in which heads and tails occur or which coins are heads or tails.
Using this nomenclature, a system of 5 coins has the 6 possible macrostates just listed. Some macrostates are more likely to occur than others. For instance, there is only one way to get 5 heads, but there are several ways to get 3 heads and 2 tails, making the latter macrostate more probable. Table 8.14.1 lists of all the ways in which 5 coins can be tossed, taking into account the order in which heads and tails occur. Each sequence is called a microstate—a detailed description of every element of a system.
| Individual microstates | Number of microstates | |
|---|---|---|
| 5 heads, 0 tails | HHHHH | 1 |
| 4 heads, 1 tail | HHHHT, HHHTH, HHTHH, HTHHH, THHHH | 5 |
| 3 heads, 2 tails | HTHTH, THTHH, HTHHT, THHTH, THHHT HTHTH, THTHH, HTHHT, THHTH, THHHT | 10 |
| 2 heads, 3 tails | TTTHH, TTHHT, THHTT, HHTTT, TTHTH, THTHT, HTHTT, THTTH, HTTHT, HTTTH | 10 |
| 1 head, 4 tails | TTTTH, TTTHT, TTHTT, THTTT, HTTTT | 5 |
| 0 heads, 5 tails | TTTTT | 1 |
| Total: 32 |
The macrostate of 3 heads and 2 tails can be achieved in 10 ways and is thus 10 times more probable than the one having 5 heads. Not surprisingly, it is equally probable to have the reverse, 2 heads and 3 tails. Similarly, it is equally probable to get 5 tails as it is to get 5 heads. Note that all of these conclusions are based on the crucial assumption that each microstate is equally probable. With coin tosses, this requires that the coins not be asymmetric in a way that favors one side over the other, as with loaded dice. For this counting argument, the accessible microstates must be equally probable.
For five fair coins, the macrostates with all heads or all tails each have one microstate. Together, they account for only 2 of the 32 equally likely outcomes. The macrostates with three heads and two tails, or two heads and three tails, together have 20 microstates. They are therefore much more likely. Starting with five heads and tossing the coins again is likely to produce a macrostate compatible with more microstates. The reverse remains possible, but is less likely.
| Macrostate | Number of microstates | |
|---|---|---|
| Heads | Tails | (W) |
| 100 | 0 | 1 |
| 99 | 1 | |
| 95 | 5 | |
| 90 | 10 | |
| 75 | 25 | |
| 60 | 40 | |
| 55 | 45 | |
| 51 | 49 | |
| 50 | 50 | |
| 49 | 51 | |
| 45 | 55 | |
| 40 | 60 | |
| 25 | 75 | |
| 10 | 90 | |
| 5 | 95 | |
| 1 | 99 | |
| 0 | 100 | 1 |
| Total: | ||
This result becomes dramatic for larger systems. Consider what happens if you have 100 coins instead of just 5. The macrostates with the fewest microstates are 100 heads or 100 tails. The macrostate with the most microstates is 50 heads and 50 tails. There is only 1 way (1 microstate) to get the all-heads arrangement of 100 heads. There are 100 ways (100 microstates) to get the arrangement of 99 heads and 1 tail (also 100 to get its reverse). And there are ways to get 50 heads and 50 tails, the most probable macrostate. Table 8.14.2 is an abbreviated list of the various macrostates and the number of microstates for each macrostate. The total number of microstates—the total number of different ways 100 coins can be tossed—is an impressively large . Now, if we start with a macrostate like 100 heads and toss the coins, there is a virtual certainty that we will get a macrostate with more microstates. If we keep tossing the coins, it is possible, but exceedingly unlikely, that we will ever get back to the all-heads or all-tails macrostate. If you tossed the coins once each second, you could expect to get either 100 heads or 100 tails once in years! This period is 1 trillion () times longer than the age of the universe, and so the chances are essentially zero. In contrast, there is an 8% chance of getting 50 heads, a 73% chance of getting from 45 to 55 heads, and a 96% chance of getting from 40 to 60 heads. Macrostates with more microstates are more likely.
Disorder in a Gas
The rapid growth in the odds favoring macrostates with more microstates that we see in going from 5 to 100 coins continues as the number of entities in the system increases. Let us now imagine applying this approach to perhaps a small sample of gas. Because counting microstates and macrostates involves statistics, this is called statistical analysis. The macrostates of a gas correspond to its macroscopic properties, such as volume, temperature, and pressure; and its microstates correspond to the detailed description of the positions and velocities of its atoms. Even a small amount of gas has a huge number of atoms: of an ideal gas at 1.0 atm and has atoms. So each macrostate has an immense number of microstates. In plain language, this means that there are an immense number of ways in which the atoms in a gas can be arranged, while still having the same pressure, temperature, and so on.
For a gas in equilibrium, a nearly uniform distribution of molecules throughout the available volume is compatible with far more microscopic arrangements than a state with all molecules confined to one small region. A substantial spontaneous concentration of the molecules is therefore overwhelmingly unlikely. This statistical imbalance explains why an isolated gas expands into available space.
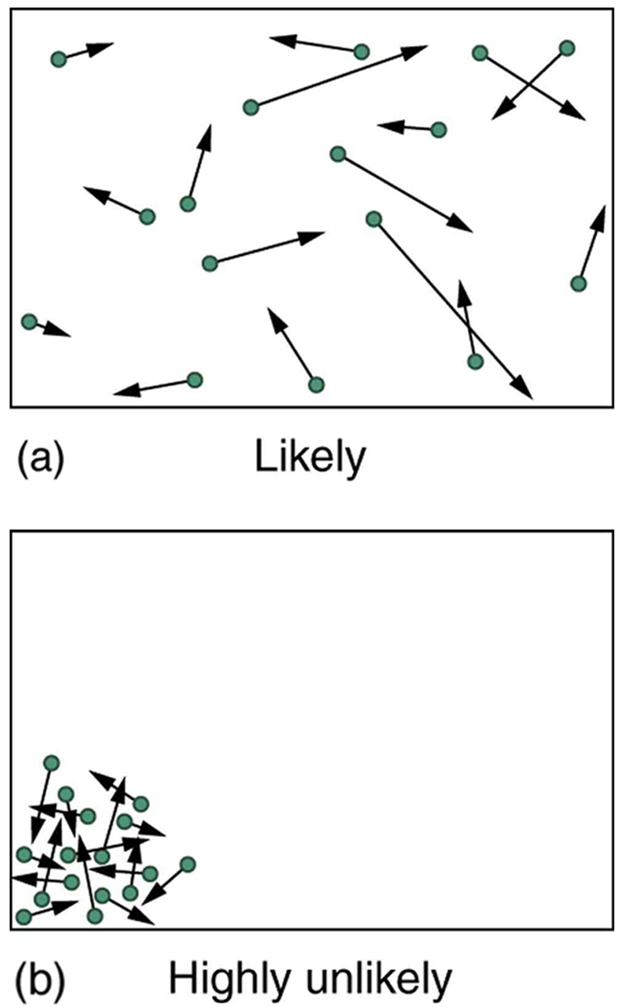
The gas has greater entropy when more positions are available to its molecules. We can reduce its entropy by compressing it at constant temperature, doing work and transferring heat to the surroundings. The entropy gained by the surroundings equals the gas’s entropy decrease for reversible compression, and exceeds it for irreversible compression. If the compressed gas is then allowed to expand freely into an evacuated part of an insulated container, its entropy increases. A spontaneous return to the concentrated state (Figure 8.14.2(b)) is overwhelmingly unlikely. The expanded macrostate is compatible with vastly more microscopic arrangements.
Macrostates with more compatible microstates have greater entropy and are more probable. The great Austrian physicist Ludwig Boltzmann (1844–1906)—who, along with Maxwell, made so many contributions to kinetic theory—proved that the entropy of a system in a given state (a macrostate) can be written as
,
(8.14.1)where is Boltzmann’s constant, and is the natural logarithm of the number of microstates corresponding to the given macrostate. is proportional to the probability that the macrostate will occur when the accessible microstates are equally probable. Thus entropy is directly related to the probability of a state—the more likely the state, the greater its entropy. Boltzmann proved that this expression for is equivalent to the definition , for reversible heat transfer at constant temperature, which we have used extensively. The formula is included here as a reference; no logarithm calculations are needed for this section. The key point is that more microstates correspond to greater entropy.
Thus the second law of thermodynamics is explained on a statistical level: the entropy of an isolated macroscopic system remains constant or increases. Macrostates with greater entropy have vastly more microstates, making a substantial spontaneous decrease overwhelmingly unlikely. A system that exchanges heat with its surroundings can decrease in entropy while the total entropy of the system and surroundings increases or remains constant.
Example 8.14.1
Entropy Increases in a Coin Toss
Suppose you toss 100 coins starting with 60 heads and 40 tails, and you get the most likely result, 50 heads and 50 tails. Does the entropy increase or decrease?
Strategy
Compare the numbers of microstates for the two macrostates in Table 8.14.2. The macrostate with more microstates has greater entropy.
Solution
The 60-heads, 40-tails macrostate has microstates. The 50-heads, 50-tails macrostate has microstates, about seven times as many. The entropy therefore increases.
Discussion
It is not impossible for further tosses to produce the initial state of 60 heads and 40 tails, but it is less likely than 50 heads and 50 tails. The coin model illustrates why a macrostate with more microstates is more likely. For an isolated macroscopic physical system, a substantial spontaneous decrease in total entropy is overwhelmingly unlikely.
Chapter questions and exercises