14.6
Half-Life and Activity
Chapter contents: Chapter 14: Nuclear and Particle Physics
Unstable nuclei decay. However, some nuclides decay faster than others. For example, radium and polonium, discovered by the Curies, decay faster than uranium. This means they have shorter lifetimes, producing a greater rate of decay. In this section we explore half-life and activity, the quantitative terms for lifetime and rate of decay.
Half-Life
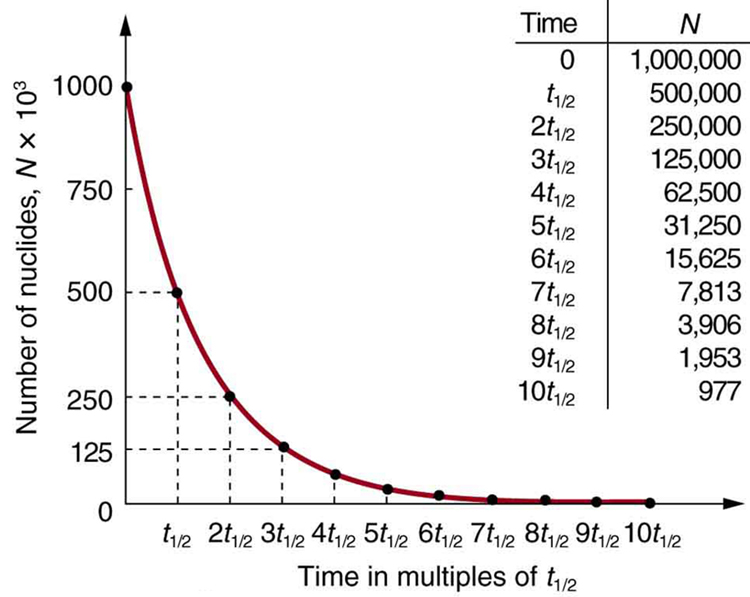
Why use a term like half-life rather than lifetime? The answer can be found by examining Figure 14.6.1, which shows how the number of radioactive nuclei in a sample decreases with time. The time in which half of the original number of nuclei decay is defined as the half-life, . Half of the remaining nuclei decay in the next half-life. Further, half of that amount decays in the following half-life. Therefore, the number of radioactive nuclei decreases from to in one half-life, then to in the next, and to in the next, and so on. If is a large number, then many half-lives (not just two) pass before all of the nuclei decay. Nuclear decay is an example of a purely statistical process. A more precise definition of half-life is that each nucleus has a 50% chance of living for a time equal to one half-life . Thus, if is reasonably large, half of the original nuclei decay in a time of one half-life. If an individual nucleus makes it through that time, it still has a 50% chance of surviving through another half-life. Even if it happens to make it through hundreds of half-lives, it still has a 50% chance of surviving through one more. The probability of decay is the same no matter when you start counting. This is like random coin flipping. The chance of heads is 50%, no matter what has happened before.
There is a tremendous range in the half-lives of various nuclides, from as short as s for the most unstable, to more than y for the least unstable, or about 46 orders of magnitude. Nuclides with the shortest half-lives are those for which the nuclear forces are least attractive, an indication of the extent to which the nuclear force can depend on the particular combination of neutrons and protons. The concept of half-life is applicable to other subatomic particles. It is also applicable to the decay of excited states in atoms and nuclei.
For simple multiples of half-life , the following intuitive expression relates original and future amounts.
(14.6.1)
This expression shows that the amount is reduced by half during each half-life. For example, using the data in Figure 1, after three half-lives we see that one-eighth of the original number remains.
And after ten half-lives 1/1024 of the original remains.
For an arbitrary time, not just a multiple of the half-life, the exponential relationship shown below is generally used.
The following equation gives the quantitative relationship between the original number of nuclei present at time zero and the number at a later time t:
,
(14.6.2)where is the base of the natural logarithm, and is the decay constant for the nuclide. The shorter the half-life, the larger is the value of , and the faster the exponential decreases with time. The relationship between the decay constant and the half-life is
.
(14.6.3)To see how the number of nuclei declines to half its original value in one half-life, let in the exponential in the equation . This gives .
Radioactive dating is a clever use of naturally occurring radioactivity. Its most famous application is carbon-14 dating. Carbon-14 has a half-life of 5700 years and is produced in a nuclear reaction induced when neutrons produced by cosmic rays strike in the atmosphere. Radioactive carbon has the same chemistry as stable carbon, and so it mixes into the ecosphere, where it is consumed and becomes part of every living organism. Carbon-14 has an abundance of 1.3 parts per trillion of normal carbon. Thus, if you know the number of carbon nuclei in an object (perhaps determined by mass and Avogadro’s number), you multiply that number by to find the number of
nuclei in the object. When an organism dies, carbon exchange with the environment ceases, and
is not replenished as it decays. By comparing the abundance of
in an artifact, such as mummy wrappings, with the normal abundance in living tissue, it is possible to determine the artifact’s age (or time since death). Carbon-14 dating can be used for biological tissues as old as 50 or 60 thousand years, but is most accurate for younger samples, since the abundance of
nuclei in them is greater. Very old biological materials contain no
at all. There are instances in which the date of an artifact can be determined by other means, such as historical knowledge or tree-ring counting. These cross-references have confirmed the validity of carbon-14 dating and permitted us to calibrate the technique as well. Carbon-14 dating revolutionized parts of archaeology and is of such importance that it earned the 1960 Nobel Prize in chemistry for its developer, the American chemist Willard Libby (1908–1980).
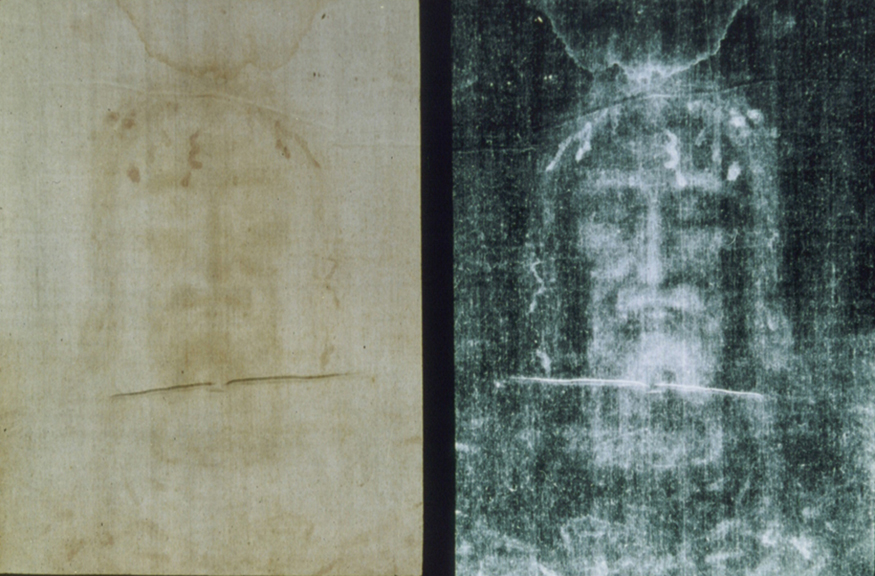
One of the most famous cases of carbon-14 dating involves the Shroud of Turin, a long piece of fabric purported to be the burial shroud of Jesus (see Figure 14.6.2). This relic was first displayed in Lirey, France, in the 1350s. Its remarkable negative imprint of an apparently crucified body resembles the then-accepted image of Jesus, and so the shroud was never disregarded completely and remained controversial over the centuries. Carbon-14 dating was not performed on the shroud until 1988, when the process had been refined to the point where only a small amount of material needed to be destroyed. Samples were tested at three independent laboratories, each receiving a shroud sample and control samples. All three laboratories obtained medieval dates. The following example uses a rounded value of 92% to illustrate the dating calculation (see Example 14.6.1).
Example 14.6.1
How Old Is the Shroud of Turin?
Calculate the age of the Shroud of Turin using the approximation that the amount of found in it is 92% of that in living tissue.
Strategy
Knowing that 92% of the remains means that . Therefore, the equation can be used to find . We also know that the half-life of is 5700 y, and so once is known, we can use the equation to find and then find as requested. Here, we postulate that the decrease in is solely due to nuclear decay.
Solution
Solving the equation for gives
.
Thus,
.
Taking the natural logarithm of both sides of the equation yields
so that
.
Rearranging to isolate gives
.
Now, the equation can be used to find for . Solving for and substituting the known half-life gives
.
We enter this value into the previous equation to find :
.
Discussion
This simplified calculation dates the material to about AD 1300, using 1988 as the measurement year. The published study reported a calibrated date range of AD 1260–1390 with at least 95% confidence. Calibration accounts for changes in atmospheric carbon-14 over time. The medieval date is consistent with the first record of the shroud’s existence and inconsistent with the period in which Jesus lived.
There are other forms of radioactive dating. Rocks, for example, can sometimes be dated based on the decay of . The decay series for ends with , so that the ratio of these nuclides in a rock is an indication of how long it has been since the rock solidified. The original composition of the rock, such as the absence of lead, must be known with some confidence. However, as with carbon-14 dating, the technique can be verified by a consistent body of knowledge. Since has a half-life of y, it is useful for dating only very old materials, showing, for example, that the oldest rocks on Earth solidified about years ago.
Activity, the Rate of Decay
What do we mean when we say a source is highly radioactive? Generally, this means the number of decays per unit time is very high. We define activity to be the rate of decay expressed in decays per unit time. In equation form, this is
Activity is an expected decay rate. A count measured during a finite interval fluctuates statistically, and a detector may register only some of the decays.
(14.6.4)
where is the number of decays that occur in time . The SI unit for activity is one decay per second and is given the name becquerel (Bq) in honor of the discoverer of radioactivity. That is,
.
(14.6.5)Activity is often expressed in other units, such as decays per minute or decays per year. One of the most common units for activity is the curie (Ci), originally based on the activity of 1 g of , in honor of Marie Curie’s work with radium. The definition of curie is
,
(14.6.6)or decays per second. A curie is a large unit of activity, while a becquerel is a relatively small unit. . In countries like Australia and New Zealand that adhere more to SI units, most radioactive sources, such as those used in medical diagnostics or in physics laboratories, are labeled in Bq or megabecquerel (MBq).
Intuitively, you would expect the activity of a source to depend on two things: the amount of the radioactive substance present, and its half-life. The greater the number of radioactive nuclei present in the sample, the more will decay per unit of time. The shorter the half-life, the more decays per unit time, for a given number of nuclei. So activity should be proportional to the number of radioactive nuclei, , and inversely proportional to their half-life, . In fact, your intuition is correct. It can be shown that the activity of a source is
(14.6.7)
where is the number of radioactive nuclei present, having half-life . This relationship is useful in a variety of calculations, as the next two examples illustrate.
Example 14.6.2
How Great Is the Activity in Living Tissue?
Calculate the activity due to in 1.00 kg of carbon found in a living organism. Express the activity in units of Bq and Ci.
Strategy
To find the activity using the equation , we must know and . The half-life of can be found in Appendix B, and was stated above as 5700 y. To find , we first find the number of nuclei in 1.00 kg of carbon using the concept of a mole. As indicated, we then multiply by (the abundance of in a carbon sample from a living organism) to get the number of nuclei in a living organism.
Solution
One mole of carbon has a mass of 12.0 g, since it is nearly pure . (A mole has a mass in grams equal in magnitude to found in the periodic table.) Thus the number of carbon nuclei in a kilogram is
.
So the number of nuclei in 1 kg of carbon is
.
Now the activity is found using the equation .
Entering known values gives
,
or decays per year. To convert this to the unit Bq, we simply convert years to seconds. Thus,
,
or 251 decays per second. To express in curies, we use the definition of a curie,
.
Thus,
.
Discussion
Our own bodies contain kilograms of carbon, and it is intriguing to think there are hundreds of decays per second taking place in us. Carbon-14 and other naturally occurring radioactive substances in our bodies contribute to the background radiation we receive. The small number of decays per second found for a kilogram of carbon in this example gives you some idea of how difficult it is to detect in a small sample of material. If there are 251 decays per second in a kilogram, then there are 0.251 decays per second in a gram of carbon in living tissue. To observe this, you must be able to distinguish decays from other forms of radiation, in order to reduce background noise. This becomes more difficult with an old tissue sample, since it contains less , and for samples more than 50 thousand years old, it is impossible.
Human-made (or artificial) radioactivity has been produced for decades and has many uses. Some of these include medical therapy for cancer, medical imaging and diagnostics, and food preservation by irradiation.
It is clear that radiation is hazardous.
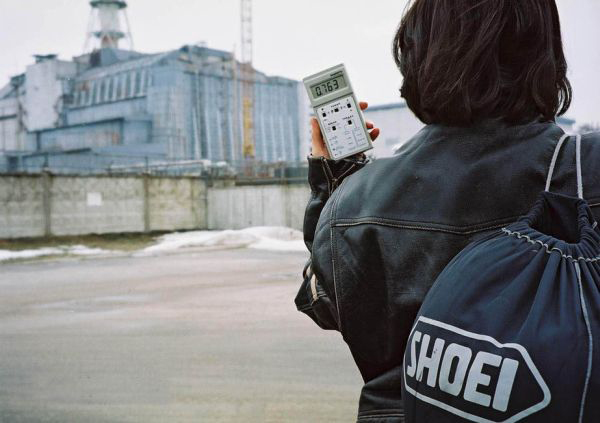
A number of tragic examples of this exist, one of the most disastrous being the meltdown and fire at the Chernobyl reactor complex in the Ukraine (see Figure 14.6.3). Several radioactive isotopes were released in huge quantities, contaminating many thousands of square kilometers and directly affecting hundreds of thousands of people. The most significant releases were of , , , , , and . Estimates are that the total amount of radiation released was about 100 million curies.
Human and Medical Applications
Example 14.6.3
What Mass of Escaped Chernobyl?
It is estimated that the Chernobyl disaster released 6.0 MCi of into the environment. Calculate the mass of released.
Strategy
We can calculate the mass released using Avogadro’s number and the concept of a mole if we can first find the number of nuclei released. Since the activity is given, and the half-life of is found in Appendix B to be 30.2 y, we can use the equation to find .
Solution
Solving the equation for gives
.
Entering the given values yields
.
Converting curies to becquerels and years to seconds, we get
.
One mole of a nuclide has a mass of grams, so that one mole of has a mass of 137 g. A mole has nuclei. Thus the mass of released was
.
Discussion
While 70 kg of material may not be a very large mass compared to the amount of fuel in a power plant, it is extremely radioactive, since it only has a 30-year half-life. Six megacuries (6.0 MCi) is an extraordinary amount of activity but is only a fraction of what is produced in nuclear reactors. Similar amounts of the other isotopes were also released at Chernobyl. Although the chances of such a disaster may have seemed small, the consequences were extremely severe, requiring greater caution than was used.
Activity decreases in time, going to half its original value in one half-life, then to one-fourth its original value in the next half-life, and so on. Since , the activity decreases as the number of radioactive nuclei decreases. The equation for as a function of time is found by combining the equations and , yielding
,
(14.6.8)where is the activity at . This equation shows exponential decay of radioactive nuclei. For example, if a source originally has a 1.00-mCi activity, it declines to 0.500 mCi in one half-life, to 0.250 mCi in two half-lives, to 0.125 mCi in three half-lives, and so on. For times other than whole half-lives, the equation must be used to find .